Reflectivity Curves and Distance Gain Size (DGS) for Discontinuity Sizing
The use of Reflectivity Curves and the Distance Gain Size (DGS) method are useful techniques for the sizing of discontinuities using Ultrasonics.
The principal works on the theoretical relationship between the signal of a reflector at a specific distance and amplitude when compared to a known reflector.
These assessments are typically carried out in two ways:
- Use of Reflectivity Curves
- DGS Software or Calculations
Reflectivity Curves
Reflectivity Curves are generated by calculating the theoretical position and amplitude of known reflectors. A common technique is to use the formulas proposed by I N Ermolov in his 1972 Paper, “The reflection of ultrasonic waves from targets of simple geometry”, Non-Destructive Testing 5 (1972), pp 87-91”. These formulas provide a theoretical basis for comparing the relative amplitude of different reflectors at different sound beam paths.
Ermolov proposed a variety of formulas for different reflector types including point reflectors (smaller than the beam spread), elongated targets (one axis greater than the beam spread) and infinite targets (larger than the beam spread e.g. Back Wall Echo).
These generated curves are often normalised, so that a variety of probe, frequency, material combinations can be employed by the same curve. The normalisation is done though using the Near Zone Length and amplitude in Decibels as the common axis.
Below is an example of a Normalised Reflectivity Curve as referenced in AS 2574-2000.

Figure 1: Normalised Reflectivity Curve, AS 2574-2000
It is apparent from the chart that there are variations of the curve profile dependant on beam path and relative equivalent reflector diameter.
In the supplied normalised curve, Figure 1, the following relationships are evident.
Back Wall Echo (BWE)
The BWE is larger than the beam spread, therefore the relationship between distance and amplitude is theoretically inversely proportional. Double the distance, receive half the reflected amplitude (6dB).
Flat Bottom Hole Reflector
The FBH is smaller than the beam spread, therefore the relationship between distance and amplitude is theoretically inversely squared. Double the distance, receive one quarter of the reflected amplitude (12dB).
The hatched section represents areas where size assessment is not suitable, these include:
- The Near Zone
- When the relative equivalent reflector diameter is greater than 1.
It can also be seen that stabilisation of the curve gradients does not occur until approximately three (3) Near Zone lengths. For this reason, wherever practicable to minimise significant possible amplitude variations (predicted to be up to 12 dB), the curves should be utilised beyond a minimum of three (3) Near Zones.
Two fully worked scenarios for using the reflectivity curve from AS 2574-2000 are shown in Appendix A.
Distance Gain Size (DGS)
The DGS method is conducted by using the specific variables of the Probe/Material (Diameter, Frequency, Material Velocity and Attenuation), to create a curve specific to those variables. This is commonly performed directly on the Flaw Detector using inbuilt software. This enables rapid assessment of reflector equivalent size, without the need to perform numerous calculations or manually plot on the curve.
A more detailed look at this software will be conducted in an upcoming article.
Usage
The use of Reflectivity Curves and Distance Gain Size (DGS) for Discontinuity Sizing needs to be performed with the knowledge that actual discontinuities rarely behave as per the theoretical basis that these methods rely on.
A significant range of variables are present and include:
- Actual discontinuity shape/profile
- Angle of orientation
- Probe beam bandwidth characteristics
- Inability to maximise discontinuity on beam axis
- Material Attenuation when using comparative reflector method.
These variables may have significant impact on results and as such, whilst providing some level of accuracy, these techniques should be limited to applications where their use has been approved in the procedure/standard and the limitations understood and acknowledged.
A more detailed look at this software will be conducted in an upcoming article.
Reflectivity Diagram Calculations: Flat Bottom Holes (FBH)
Scenario 1
Probe: 24mm Diameter, 2MHz normal probe, compression in steel.
Using the Back Wall Echo (BWE) at 500mm beam path as a reference, an indication at 300mm beam path is detected with an amplitude -18dB of the BWE reference. What is the approximate equivalent Flat Bottom Hole (FBH) size of the indication?
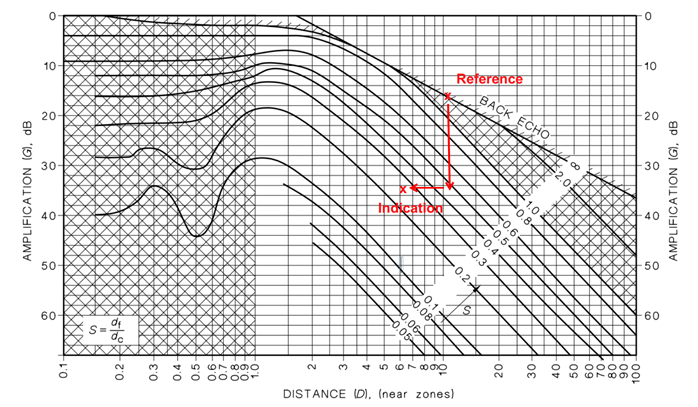
Figure 2: Scenario 1 Normalised Reflectivity Curve
Scenario 2
Probe: 10mm Diameter, 4MHz normal probe, compression in steel.
Using a 4mm diameter Flat Bottom Hole (FBH) at 125mm beam path as a reference, an indication at 75mm beam path is detected with an amplitude +14dB of the reference. What is the approximate equivalent Flat Bottom Hole (FBH) size of the indication?
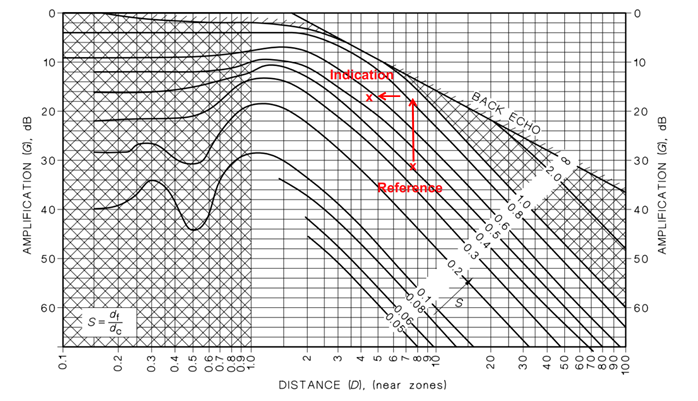
Figure 3: Scenario 2 Normalised Reflectivity Curve
Contact Us
To know more about our NDT training programs, course schedule and upcoming course dates, you can contact us via training@attar.com.au or visit our “Course Schedule and Enrollment Forms” page.
